Stock Market Today: PPI Inflation Report, Jobs Data Boost Markets On Thursday

Updated: April 13, 2023, 2:35 PM ET
Another week of economic data is moving large caps and penny stocks alike this week. Wednesday’s CPI Inflation Report for March showed some signs that inflation was easing for the U.S. consumer. However, the Core number remained a sticking point for some. Comments from several Fed speakers, including Mary Daly and Thomas Barkin, brought more into the mix as investors try to gauge what the central bank is thinking about its next rate hike decision.
“We had some good news today on the CPI. Headline release showed that it’s going down, it’s going in the right direction, but it’s still elevated. It’s not consistent with price stability. And I’m going to be looking specifically in the CPI and in our other measures to see if core services are coming down and really core services minus housing.,” explained San Francisco Fed President Mary Daly on April 12th.
Meanwhile, President Barkin’s comments remained a bit more focused on the Core CPI data specifically. In an interview with CNBC, Barkin said, “I put particular focus on the core, which is still running a little over 5% year over year. And you know, we had some good news on energy, but there’s still more to do, I think to get core inflation back down to where we’d like it to be.”
Barkin also said it would be hard to make a case that inflation is “compellingly” headed toward the Fed’s target.
Fed Comments In Focus
Yesterday’s Fed meeting minutes from the March meeting also gave clues that the staff may actually be expecting some type of recession this year, which is a different tone than in previous meetings.

In particular, the Fed minutes highlighted this in the statement:
“Given their assessment of the potential economic effects of the recent banking-sector developments, the staff’s projection at the time of the March meeting included a mild recession starting later this year, with a recovery over the subsequent two years.”
With PPI inflation data on deck, eyes will be glued to see what Core vs overall producer prices are reflecting ahead of the next FOMC meeting in May.
Let’s go over some of the basics for those who may not be familiar with and are asking questions like:
- What is PPI in economics?
- PPI Inflation Data vs. CPI Inflation Data & Why PPI data matters to the stock market today
- How can PPI inflation data be used in your investing and trading strategy?; and lastly
- What are the results of the January PPI inflation report?
What are the results of the September PPI inflation report?
What Is PPI Inflation Data & What Is The PPI Report?
PPI is “a measure of the average change over time in the selling prices received by domestic producers for their output is what has defined the producer pricing index,” according to the U.S. Bureau of Labor Statistics. “The prices included in the PPI are from the first commercial transaction for many products and some services.”
– 3 Methods for Finding Penny Stocks to Buy and Hold
PPI vs. CPI: Why Does PPI Matter?
The Produce Price Index inflation data matters because it is a data point for investors to understand future inflationary tendencies. It can also be used as a means for enacting monetary policy.
CPI Data V.S. PPI Data
Compared to CPI data, Producer Prices in the PPI report show a picture from the lens of companies producing final products, what their input costs are, and give a glimpse into whether or not prices could trigger a jump or drop in retail costs that consumers incur.
PPI Expectations March 2023
Let’s look at PPI expectations for March 2023. The year-over-year PPI estimates for March are set at 3%. This would be less than the 4.6% PPI readout from the last Produce Price inflation report. The month-over-month figures are likely to be the most telling sign for the market. Estimates put this at 0.1% for March. Core PPI inflation expectations are 0.3% month-over-month and 3.4% year-over-year.
The Producer Price Index Report For March 2023 & PPI Numbers
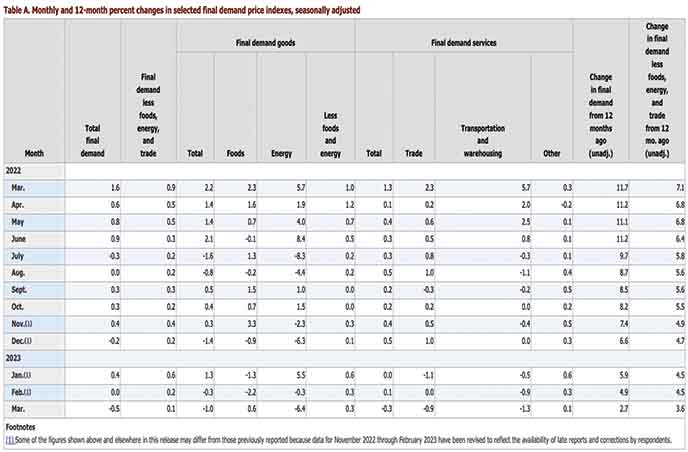
The Producer Price Index for final demand declined 0.5 percent in March, seasonally adjusted, the U.S. Bureau of Labor Statistics reported today. Final demand prices were unchanged in February and increased 0.4 percent in January. (See table A.) On an unadjusted basis, the index for final demand advanced 2.7 percent for the 12 months ended in March.
In March, two-thirds of the decline in the index for final demand can be attributed to a 1.0- percent decrease in prices for final demand goods. The index for final demand services moved down 0.3 percent.
Prices for final demand less foods, energy, and trade services edged up 0.1 percent in March after rising 0.2 percent in February. For the 12 months ended in March, the index for final demand less foods, energy, and trade services increased 3.6 percent.
Final Demand
Final demand goods: Prices for final demand goods decreased 1.0 percent in March after falling 0.3 percent in February. The March decline is attributable to the index for final demand energy, which dropped 6.4 percent. In contrast, prices for final demand goods less foods and energy and for final demand foods advanced 0.3 percent and 0.6 percent, respectively.
Product detail: Eighty percent of the March decline in the index for final demand goods can be traced to an 11.7-percent drop in prices for gasoline. The indexes for diesel fuel, residential natural gas, jet fuel, electric power, and fresh and dry vegetables also fell. Conversely, prices for light motor trucks increased 0.7 percent. The indexes for chicken eggs and for meats also moved higher. (See table 2.)
Final demand services: Prices for final demand services moved down 0.3 percent in March, the largest decline since falling 0.5 percent in April 2020. Leading the March decrease, margins for final demand trade services dropped 0.9 percent. (Trade indexes measure changes in margins received by wholesalers and retailers.) The index for final demand transportation and warehousing services fell 1.3 percent. In contrast, prices for final demand services less trade, transportation, and warehousing edged up 0.1 percent.
Product detail: A 7.3-percent drop in margins for machinery and vehicle wholesaling was a major factor in the March decrease in prices for final demand services. The indexes for truck transportation of freight, portfolio management, fuels and lubricants retailing, loan services (partial), and automobiles and automobile parts retailing also moved down. Conversely, prices for guestroom rental rose 4.6 percent. The indexes for food retailing and for transportation of passengers (partial) also advanced.
Breaking Down The PPI Report: Key Takeaways
- PPI Inflation Data for January came in at 2.7% BELOW expectations
- PPI Inflation Data month over month came in at -0.5%, BELOW expectations
- Core PPI was 3.4% year over year and -0.1% month over month
- For the 12 months ended in March, the index for processed goods for intermediate demand moved down 1.0 percent, the largest 12-month decrease since a 1.6- percent decline in September 2020.
- Unprocessed goods for intermediate demand: The index for unprocessed goods for intermediate demand moved down 5.0 percent in March, the largest decline since falling 9.7 percent in October 2022.
- For the 12 months ended in March, prices for unprocessed goods for intermediate demand declined 17.0 percent, the largest 12-month decrease since a 20.1-percent drop in May 2020.
Immediately following the PPI inflation report for March, Broader markets pushed slightly higher. The S&P 500 (NYSEARCA: SPY) broke back above $409, NASDAQ (NASDAQ: QQQ) briefly reclaimed $315, and popular stocks, including Apple (NASDAQ: AAPL) and Tesla (NASDAQ: TSLA) inched higher above Wednesday’s closing levels. Meanwhile, stocks including Caterpillar (NYSE: CAT) remained muted prior to Thursday’s opening bell.
Jobless Claims Show Signs Of Cracks
In tandem with the latest Producer Price Index results, more jobs data was released in the stock market today. Initial jobless claims came in at 239,000 compared to the 232,000 expected. Meanwhile, continuing jobless claims for unemployment benefits dropped to 1.810 million, which was down from the 1.823 million in the week prior.
The weakness in the labor market, generally considered “bad news,” was positive when it comes to the Federal Reserve’s battle to combat inflation. It is also a sign the economy is cooling a bit thanks to tighter monetary policy. A higher number of claims could signal early signs of an economic downturn, which reignited yesterday’s Fed staff comments regarding an expected recession this year. Now eyes will be on the start of earnings season Friday with several big banks reporting results.
Stock Market Today
Following a volatile early morning session, markets traded higher throughout the Thursday session. The SPY tested premarket highs the ETF traded at during premarket hours on Wednesday. It was also the highest intra-day high put-in since February 15th. The cooling price pressures and softer jobs market brought a sense of calm back to investors in the stock market today.
The question now is will it last? Friday marks the start of a new earnings season with several major banks reporting, including:
Other companies like UnitedHealth (UNH) and Byrna Technologies (BYRN) also report earnings.