PPI Report Live: Producer Price Inflation Report Is Out, Here’s What It Shows

Originally Publish 2/16/2023 8:30 AM ET
A mix of economic data, earnings reports, guidance, and general stock market sentiment is driving all stocks right now. That includes penny stocks and higher-priced ones alike. While broader trends tend to be less impactful to cheap stocks, it’s good to take them into account because they can greatly influence different sector trends, which can have a greater influence over things like penny stocks.
This month we got the first taste of inflation data from the January CPI report. The inflation data was the first to come out under the new weighting system and it was the first report of the year showing numbers that were above expectations. While markets initially traded lower, the negative sentiment was shaken off by Wednesday’s closing bell, where stocks traded near the highs of the week.
Now, investors are focused on the next round of economic reports, including the first PPI inflation report of the year. That will be coupled with more job and employment data that could sway the outlook and influence the way traders approach markets.
Though in the January/February FOMC meeting, the Fed explained its stance on rate hikes and not hiking as aggressively this year as it did in 2022, some think that can change depending on the data. It has already shown that the labor market remains tight, and inflation is still higher than Wall Street expects. Whether or not this changes the FOMC’s stance on monetary policy in 2023 is to be seen.
What we do know is that in the stock market today, all eyes will be focusing on the PPI inflation report for January. Let’s go over some of the basics for those who may not be familiar with and are asking questions like:
- What is PPI in economics?
- PPI Inflation Data vs. CPI Inflation Data & Why PPI data matters to the stock market today
- How can PPI inflation data be used in your investing and trading strategy?; and lastly
- What are the results of the January PPI inflation report?
What are the results of the September PPI inflation report?

What Is PPI Inflation Data & What Is The PPI Report?
PPI is “a measure of the average change over time in the selling prices received by domestic producers for their output is what has defined the producer pricing index,” according to the U.S. Bureau of Labor Statistics. “The prices included in the PPI are from the first commercial transaction for many products and some services.”
PPI vs. CPI: Why Does PPI Matter?
The Produce Price Index inflation data matters because it is a data point for investors to understand future inflationary tendencies. It can also be used as a means for enacting monetary policy.
CPI Data V.S. PPI Data
Compared to CPI data, Producer Prices in the PPI report show a picture from the lens of companies producing final products, what their input costs are, and give a glimpse into whether or not prices could trigger a jump or drop in retail costs that consumers incur.
PPI Expectations January 2023
Let’s look at PPI expectations for January 2023. The year-over-year PPI estimates for January are set at 5.4%. This would be less than the 6.2% PPI readout from the last Produce Price inflation report. The month-over-month figures are likely to be the most telling sign for the market. Estimates put this at 0.4% for January. Keep in mind that almost immediately following the report, FOMC member Mester will speak, which could also sway sentiment in the stock market today
The Producer Price Index Report For January 2023 & PPI Numbers
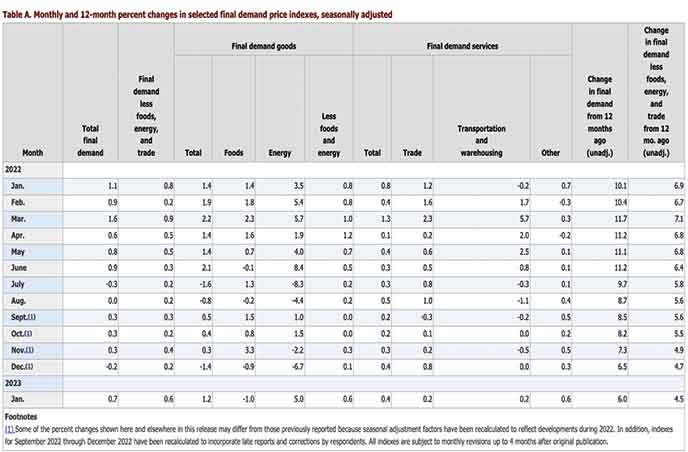
The Producer Price Index for final demand increased 0.7 percent in January, seasonally adjusted,
the U.S. Bureau of Labor Statistics reported today. Final demand prices declined 0.2 percent in
December 2022 and advanced 0.3 percent in November. (See table A.) On an unadjusted basis,
the index for final demand rose 6.0 percent for the 12 months ended January 2023.
In January, a 1.2-percent rise in prices for final demand goods led the advance in the final
demand index. Prices for final demand services also moved higher, increasing 0.4 percent.
The index for final demand less foods, energy, and trade services rose 0.6 percent in January
2023, the largest advance since moving up 0.9 percent in March 2022. For the 12 months ended
in January 2023, prices for final demand less foods, energy, and trade services increased 4.5
percent.
Final Demand
Final demand goods: The index for final demand goods moved up 1.2 percent in January, the
largest increase since rising 2.1 percent in June 2022. Most of the January advance is attributable to a
5.0-percent jump in prices for final demand energy. The index for final demand goods less foods and
energy increased 0.6 percent. In contrast, prices for final demand foods fell 1.0 percent.
Product detail: Nearly one-third of the January rise in the index for final demand goods can be traced
to prices for gasoline, which increased 6.2 percent. The indexes for residential natural gas, diesel
fuel, jet fuel, soft drinks, and motor vehicles also moved higher. Conversely, prices for fresh and dry
vegetables decreased 33.5 percent. The indexes for residual fuels and for basic organic chemicals
also declined. (See table 2.)
Final demand services: The index for final demand services advanced 0.4 percent in January, the
same as in December. Over 80 percent of the broad-based increase in January is attributable to prices
for final demand services less trade, transportation, and warehousing, which rose 0.6 percent.
Margins for final demand trade services moved up 0.2 percent. (Trade indexes measure changes in
margins received by wholesalers and retailers.) Prices for final demand transportation and
warehousing services also advanced 0.2 percent.
Product detail: A major factor in the January rise in prices for final demand services was the index
for hospital outpatient care, which jumped 1.4 percent. The indexes for automobiles and automobile
parts retailing; health, beauty, and optical goods retailing; portfolio management; chemicals and
allied products wholesaling; and airline passenger services also moved higher. In contrast, margins
for fuels and lubricants retailing fell 17.5 percent. Prices for long-distance motor carrying and for
securities brokerage, dealing, and investment advice also declined.
Breaking Down The PPI Report: Key Takeaways
PPI Inflation Data for January came in at 6% ABOVE expectations
PPI Inflation Data month over month came in at 0.7%, ABOVE expectations
Core PPI was 4.5% year over year and 0.6% month over month
Processed goods for intermediate demand: The index for processed goods for intermediate demand moved up 1.0 percent in January, the first advance since increasing 1.9 percent in June 2022. Leading the January rise, prices for processed energy goods jumped 5.4 percent. The index for processed foods and feeds advanced 0.3 percent.
Over half of the January increase in prices for processed goods for intermediate demand can be attributed to the index for diesel fuel, which rose 10.9 percent. Prices for electric power, utility natural gas, gasoline, beef and veal, and nonferrous mill shapes also advanced.
Over 60 percent of the January decline in prices for unprocessed goods for intermediate demand can be attributed to the index for natural gas, which dropped 19.1 percent. Prices for ungraded chicken eggs, crude petroleum, slaughter chickens, slaughter hogs, and recyclable paper also decreased.
Leading the advance, prices for services less trade, transportation, and warehousing for intermediate demand rose 0.8 percent. The index for transportation and warehousing services for intermediate demand moved up 0.4 percent.
Over three-quarters of the January advance in the index for services for intermediate demand can be attributed to a 6.6-percent rise in prices for loan services (partial). The indexes for services related to securities brokerage and dealing (partial), chemicals and allied products wholesaling, legal services, portfolio management, and U.S. postal services also moved higher. In contrast, margins for fuels and lubricants retailing dropped 17.5 percent.