Penny Stocks Chart School: Ascending Triangle Defined
Penny Stocks & Chart Patterns
In this Penny Stocks Chart School series, we’ll discuss some of the most popular trading patterns active traders and investors use. If you’re putting money into the stock market today, you’re participating in one of the most volatile environments in recent history.
Unique economic conditions, inflationary constraints, and general day-to-day headlines bring plenty of fluctuation to the market. For that reason, if you’re not looking to invest in penny stocks and trade them, technical analysis is vital.
Finding catalysts like news or corporate filings is an excellent first step in identifying momentum. But once that gets priced in, a lot of the short-term action can be translated by reading chart patterns. Today we answer the question: What is an ascending triangle chart pattern?
Ascending Triangle Definition & Example
Ascending Triangles are bullish chart formations and generally indicate a period of accumulation.
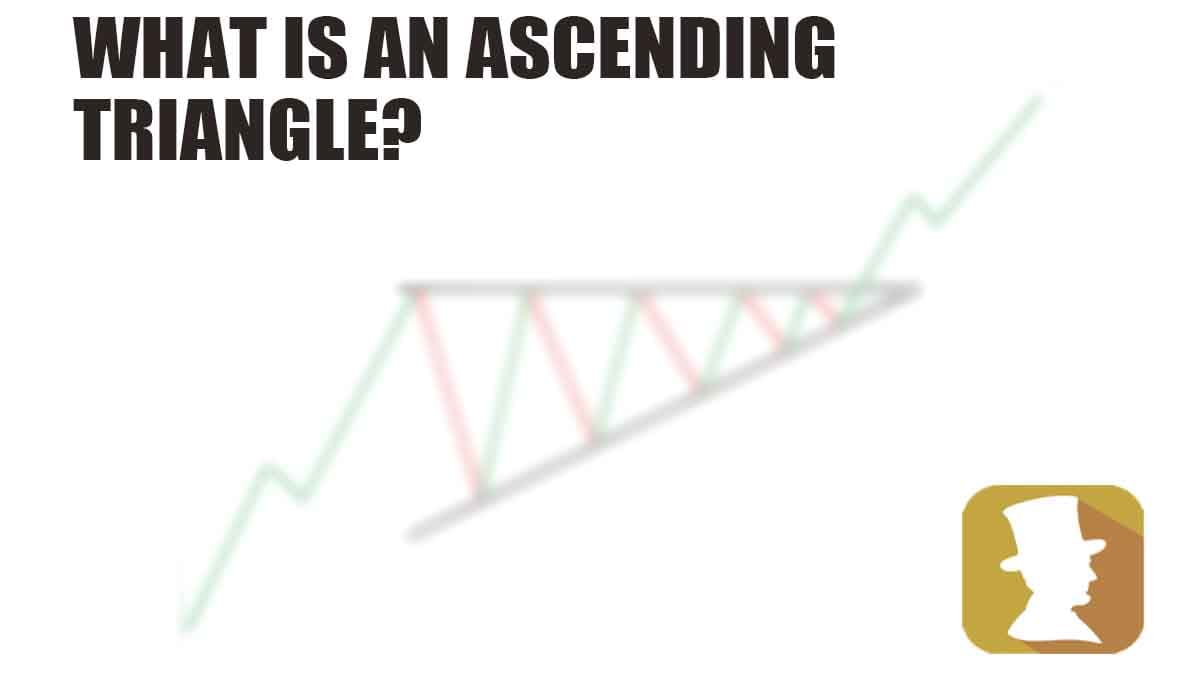
What does an ascending triangle look like?
It doesn’t matter if you’re trading penny stocks or Berkshire Hathaway (BRK.A) (BRK.B); the ascending triangle pattern is the same. It involves a period of higher lows and relatively similar highs. There’s no relative time frame necessary to confirm this pattern, but rather being able to identify it on your chart. Whether you use a 1-minute, 3-minute, or 1-day chart, ascending triangle patterns form the same way. Below is an image of such a pattern using the image below:

While the time frame is irrelevant, you’ll still want to see some consistency to confirm the trend. As a rule of thumb, you’ll want to observe a few higher lows while the trend tests similar highs. Remember that when we talk about “the same highs,” that doesn’t mean to the exact penny.
We’ll look at general zones. So if you’re talking about a $4 penny stock with a high of $4.25, $4.28, $4.22, and $4.27, there’s a good chance that you’re safe in assuming half of the ascending wedge equation is confirmed. You’ll want to ensure a clear rise in higher lows. These higher lows show an increase in buying pressure and give the ascending triangle its bullishness.
Ascending Triangle Volume Profile
Bullish chart patterns tend to include stronger levels of volume. However, an ascending triangle is a consolidation pattern and, as such, won’t have an aggressive volume profile as outright bullish patterns. However, when the ascending triangle breaks out, that is when you’ll want to see aggressive and higher levels of trading volume come in.
Should that volume not be in play, you could risk falling into a trap and a failed breakout. So during the consolidation period, lower volume isn’t detrimental, but as a stock begins breaking out of the pattern, you’ll need to confirm the trend by observing higher volume levels.
Generally speaking, if you confirm all of the above, the next step would be setting an initial profit target. While this isn’t always the case, the general idea is that the breakout move could be as significant as the widest distance within your triangle pattern from lowest low to repeat high:

Remember that these are general parameters. In real-time trading, things can change depending on market action, events, news, etc.
More About Penny Stocks
This is part of our series about Penny Stock Chart Patterns. We’ll discuss more bullish and bearish patterns so that you can be prepared for all market conditions. On top of charting, you’ll want to be able to understand many of the other nuances of trading penny stocks or higher-priced stocks in general. If you’re just getting your feet wet, check out some of these articles below:
- Buy Penny Stocks Like Hedge Funds Do: A How-To Guide
- 10 Secret Ways To Find The Best Penny Stocks To Buy In 2022 [Updated]
- Trading Options 101: A Beginner’s Guide
- Penny Stocks: 7 Day Trading Strategies for Beginners
- Are Penny Stocks Good For Beginners? [Answered]
- What Are Penny Stocks? A Beginner’s Guide To Making Money Trading
New To Trading Penny Stocks?
If you’re interested in learning more about penny stocks, the stock market, and how to trade, check out True Trading Group, the fastest-growing & highest-rated online premium educational platform available today. True Trading Group offers a 7-day Trial of its platform for $3 (non-autorenewing, nonrecurring): To Learn More Click Here.
Want the Top Penny Stocks Picks, Alerts, News & More? It’s Free & As Easy As 1, 2, 3!
- Take out your cell phone
- Open your text messaging
- Send a new text message with the word PENNYSTOCKS to 77567
If you enjoyed this article and you’re interested in learning how to trade so you can have the best chance to profit consistently then you need to checkout this YouTube channel. CLICK HERE RIGHT NOW!!