PPI Report Live: Producer Price Inflation Report Is Out, Here’s What It Shows

Published: October 11, 2023, 8:30 AM ET
Updated: October 11, 2023, 8:56 AM ET
Stocks have seen mixed trading this week as investors digest a wide range of economic reports. Meanwhile, corporate earnings and management guidance will be in the spotlight come Friday with earnings season beginning for Q3. The Federal Reserve’s monetary policy is also influencing market sentiment and today’s Fed minutes will shed more light on that topic. For traders of penny stocks and blue chip shares alike, making sense of the data deluge remains a key challenge.
Despite the stock market’s volatility, some broad trends have emerged in recent months. The S&P 500 index has largely traded within a defined channel since late March. Its 50-day moving average has provided a floor, while resistance has formed near the $434.50 level.
As new data continues to shape trader perceptions, speculation persists on which sectors and stocks offer the best opportunities. With economic indicators sending mixed signals and monetary policy in focus, navigating the choppy waters ahead will require astute analysis of each day’s developments. Patience and discipline will remain vital for investors seeking to generate profits in this dynamic market environment. Today’s focus is on the PPI inflation data and the Produce Price Index.
What Is PPI Inflation Data & What Is The PPI Report?
PPI is “a measure of the average change over time in the selling prices received by domestic producers for their output is what has defined the producer pricing index,” according to the U.S. Bureau of Labor Statistics. “The prices included in the PPI are from the first commercial transaction for many products and some services.”
– Penny Stocks To Buy Now? 3 To Watch In The Stock Market Today
PPI vs. CPI: Why Does PPI Matter?
The Produce Price Index inflation data matters because it is a data point for investors to understand future inflationary tendencies. It can also be used as a means for enacting monetary policy.
CPI Data V.S. PPI Data
Compared to CPI data, Producer Prices in the PPI report show a picture from the lens of companies producing final products, what their input costs are, and give a glimpse into whether or not prices could trigger a jump or drop in retail costs that consumers incur.
PPI Expectations September 2023
Let’s look at PPI expectations for September 2023:
- PPI Expectations (month-over-month): 0.3%, Previous read was 0.7%
- PPI Expectations (year-over-year): 1.6%, Previous read was 1.6%
- CORE PPI Expectations (month-over-month): 0.2%, Previous read was 0.2%
- CORE PPI Expectations (year-over-year): 2.3%, Previous read was 2.2%
The Producer Price Index Report For September 2023 & PPI Numbers
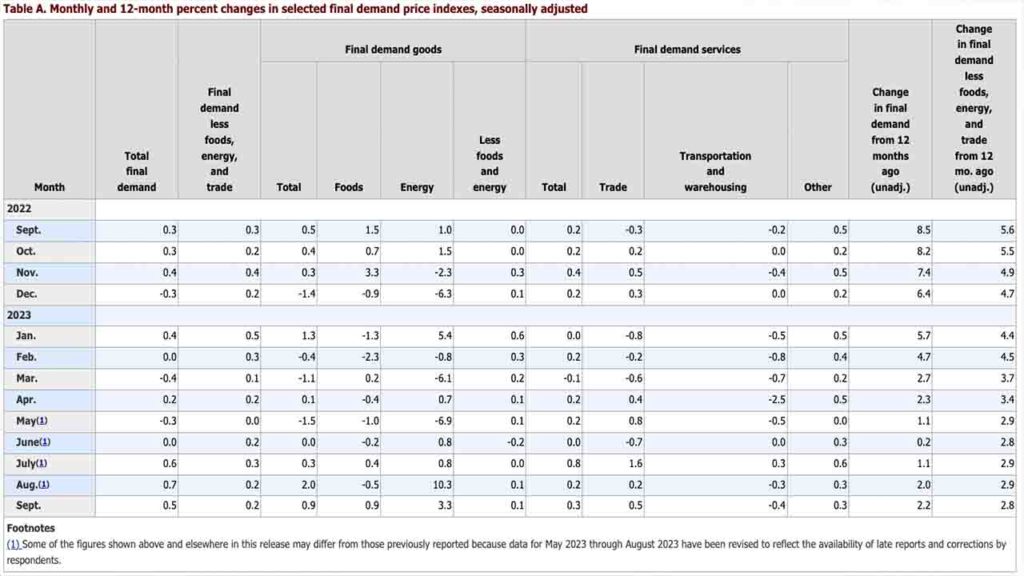
The Producer Price Index for final demand increased 0.5 percent in September, seasonally adjusted, the U.S. Bureau of Labor Statistics reported today. Final demand prices rose 0.7 percent in August and 0.6 percent in July. (See table A.) On an unadjusted basis, the index for final demand advanced 2.2 percent for the 12 months ended in September, the largest increase since moving up 2.3 percent for the 12 months ended in April.
Leading the increase in the final demand index in September, prices for final demand goods rose 0.9 percent. The index for final demand services advanced 0.3 percent.
Prices for final demand less foods, energy, and trade services increased 0.2 percent in September, the fourth consecutive advance. For the 12 months ended in September, the index for final demand less foods, energy, and trade services moved up 2.8 percent.
Final Demand
Final demand goods: The index for final demand goods moved up 0.9 percent in September, the third consecutive increase. Nearly three-quarters of the broad-based September advance is attributable to a 3.3-percent rise in prices for final demand energy. The indexes for final demand foods and for final demand goods less foods and energy moved up 0.9 percent and 0.1 percent, respectively.
Over 40 percent of the September increase in prices for final demand goods can be traced to a 5.4-percent rise in the index for gasoline. Prices for jet fuel, processed young chickens, meats, electric power, and diesel fuel also advanced. In contrast, the index for fresh and dry vegetables declined 13.9 percent. Prices for wood pulp and for utility natural gas also fell.
– What Makes Penny Stocks Move in Value?
A 13.9-percent jump in the index for deposit services (partial) was a major factor in the September rise in prices for final demand services. The indexes for machinery, equipment, parts, and supplies wholesaling; health, beauty, and optical goods retailing; traveler accommodation services; outpatient care (partial); and application software publishing also moved higher. In contrast, prices for airline passenger services fell 2.1 percent. The indexes for automobile retailing (partial) and for bundled wired telecommunications access services also decreased.
PPI Report Summary:
PPI Expectations (month-over-month): 0.3%, Previous read was 0.7%
Actual PPI (month-over-month): 0.5% ABOVE EXPECTATIONS
PPI Expectations (year-over-year): 1.6%, Previous read was 1.6%
Actual PPI (year-over-year): 2.2% ABOVE EXPECTATIONS
CORE PPI Expectations (month-over-month): 0.2%, Previous read was 0.2%
Actual CORE PPI (month-over-month): 0.3% ABOVE EXPECTATIONS
CORE PPI Expectations (year-over-year): 2.3%, Previous read was 2.2%
Actual CORE PPI Expectations (year-over-year): 2.7% ABOVE EXPECTATIONS
Stock Market Reaction To PPI Inflation Data For September
The S&P 500 (NYSEARCA: SPY) and Nasdaq (NASDAQ: QQQ) traded lower following the results. The higher-than-expected readout shows inflation at the wholesale level is still running hot. The Fed Target Rate expectations are leaning toward no rate hike for the November meeting.
According to the CME Group’s FedWatch Tool at the time of this update, there is an 86.8% probability the Fed target rate comes in between 525-550, which is also the current target rate. FedWatch also shows just a 13.2% probability of a Target Rate of 550-575.
– Penny Stocks, Catalysts & Finding Top Stocks to Buy In 2023
Now the market awaits the latest minutes from the most recent FOMC meeting to see what, if any, notes were made regarding the upcoming rate hike decision. Monetary policy has been a driving force in the stock market this year. In light of the latest hotter-than-expected inflation data, and more incoming CPI inflation data on Thursday, there are multiple catalysts to note if you’re trading in the stock market this week.