Penny Stocks & Popular Technical Indicators For Increasing Profits

Do You Know About Technical Analysis For Penny Stocks?
Many traders use technical analysis to determine which penny stocks they will invest their money in. Technical analysis revolves around taking historical price action and analyzing its patterns to make future predictions. Traders who utilize technical analysis almost always use candlestick charts because it gives traders a better picture of trading sessions.
Technical analysis combines historical price points with mathematical equations to form indicators. These indicators make predicting future price action a lot simpler and more accurate. However, you must understand they are not 100% accurate and mostly fail to account for the fundamental aspects of companies.
Four Categories Of Technical Indicators
Indicators can be broken up into four categories. These categories are trend, volume, momentum, and volatility.
Penny Stocks & Trend Indicators
Trend indicators try to show where the market is going. These are some of the simplest indicators because they visualize the high and low points that form these trends. A few examples of trend indicators would be the MACD (Moving Average Convergence Divergence) and the Parabolic SAR.
Penny Stocks & Volume Indicators
The second type of indicator is the volume indicators. These show how a stock’s volume has changed over a certain period. These are important because the volume is considered one of the most reliable confirmation indicators. For instance, if the MACD showed a bullish trend with little volume, traders would think it was a fake-out. One standard volume indicator would be the Chaikin Money Flow.
Penny Stocks & Momentum Indicators
Momentum indicators help traders analyze the true strength of a given trend. This means that traders can more accurately predict when a recovery or a reversal will happen. In more universal terms, it helps identify a stock’s highs and lows. Some of the more used momentum indicators include RSI (Relative Strength Index) and Stochastics.
Penny Stocks & Volatility Indicators
The last type of indicator is the volatility indicator. Every stock has a different amount of volatility. This helps investors analyze how much a stock can realistically move in a given time frame. For instance, penny stocks have much higher volatility and can move 10% in 10 minutes. In comparison, stocks like Facebook and Amazon move much slower due to lower volatility. Volatility indicators help identify how much a price will change over a certain period. An example of a volatility indicator is Bollinger Bands.
As you read through the indicators, you can understand why they are essential. They all help investors predict where a stock’s price might go. It helps put traders in a position to make the most money efficiently. A trader must be prepared for any direction the market can go. It helps mitigate losses or position traders to get into trades optimally.
Penny Stocks & Trend Indicators
#1: Moving Average Convergence Divergence (MACD)
This is the first trend indicator. The MACD is one of the most commonly used indicators that many use but fail to understand fully. The MACD indicator comprises three things: a fast line, a slow line, and a histogram.
Understanding the MACD can be a little complicated in text format. The fast line in the MACD is the moving average of the difference between 2 other moving averages. Those other moving averages are known as the moving average-fast and the moving average-slow. The slow line in the MACD is the moving average of the fast line over a set period. The histogram shows the differences between the MACD fast and slow lines.
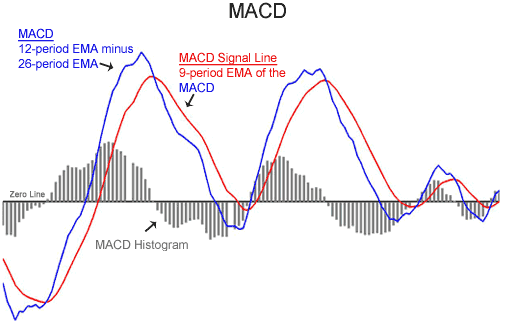
For instance, the typical settings for MACD indicators are MACD (12,26,9). To calculate the fast line, subtract the 12-period and 26-period moving averages. The “9” applies to the slow line and represents the 9-period moving average of the fast line.
What Is Convergence/Divergence?
When looking at the MACD histogram, you can see convergence and divergence. Two different things show this on the indicator. The first is when you see the histogram bars getting larger; this indicates divergence. If you see them get smaller, then convergence is happening. The fast and slow line also shows this. When they separate, divergence happens. If they are coming together, then convergence is occurring.
Read More on Penny Stocks Basics
- How To Make A Lot Of Money With Penny Stocks
- Penny Stocks: Frequently Asked Questions About Low-Priced Equities (FAQ)
A crossover on the MACD typically signals a trend reversal. When this occurs, the difference between the fast and slow lines is 0, and nothing will be on the histogram. The MACD is a lagging indicator, which is very good for confirming trends rather than predicting them.
#2: Parabolic Stop and Reverse (SAR)
The second trend indicator is known as the Parabolic SAR. When you apply this indicator to your chart, many dots will pop up. These dots are placed above and below the price and attempt to indicate where a stock’s price might go. If the dots are below the price, this is an indication the stock could be entering an uptrend. If above the price, this signals a potential downtrend.
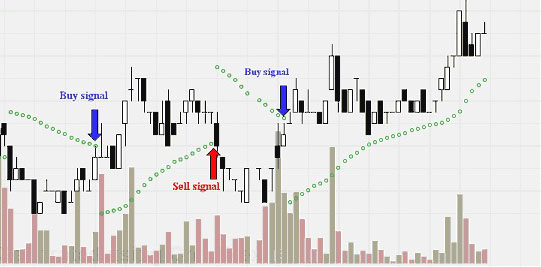
The Parabolic SAR is most useful when there is a clear trend. It is not helpful when a stock trades sideways due to the noise that can impact the SAR dots.
Penny Stocks & Momentum Indicators
#1: Average Directional Index (ADX)
The ADX ranges from 0 to 100, which helps traders identify the strength of a trend. 0 on the scale shows the weakest possible trend, while 100 is the strongest possible. When the trend goes below 20, it is considered a weak trend. If it goes above 50, then the trend is most likely strong.
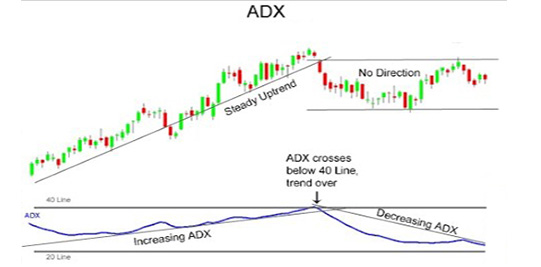
The ADX is exceptionally good for identifying potential fakeouts. This makes the ADX a very complementary indicator. You could combine it with the MACD indicator to show a possible trend and then show the strength of it. Visualizing momentum with the ADX helps traders get in trades when momentum is strong and out when it is weak.
The ADX, like moving averages, is a lagging indicator. This means utilizing the ADX is more valuable after a strong trend.
#2: Stochastic
This momentum indicator can identify when a trend is getting weaker and about to end. The Stochastic lines are also valued from 0 to 100. It shows when a stock is oversold or overbought. The Stochastic comprises two lines, typically plotted below the stock’s chart.
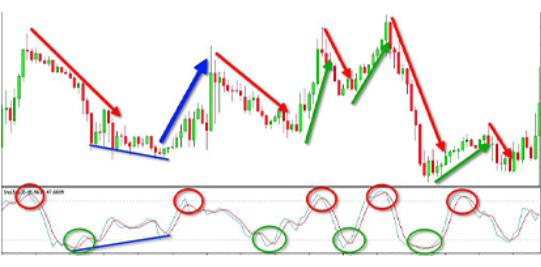
When the lines are below 20, an uptrend is likely to happen due to the stock being oversold. On the other hand, if they are above 80, a downtrend is expected to occur due to over-purchasing. This indicator is also a lagging indicator, and the same precautions regarding the ADX applies here too.
#3: Ichimoku Kinko Hyo (Ichimoku Cloud)
While the Ichimoku Cloud is also a momentum indicator, it is a little more complex with many more attributes. It also attempts to predict future price momentum, support, and resistance. The indicator has four lines overlapping the stock’s chart instead of being located beneath the chart.
The 4 lines are called Kijun Sen, Tenkan Sen, Chikou Span, Senkou Span. Here is a breakdown of all the lines and how they can impact your trading profits.
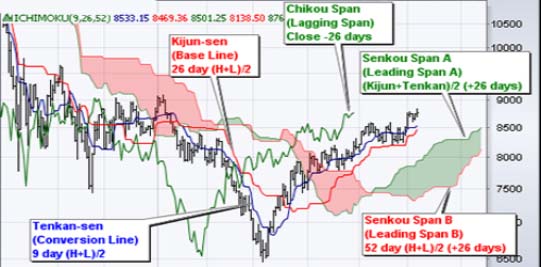
The Kijun Sen line is also known as the standard line. It is calculated by averaging the highest highs and lowest lows for the past 26 trading periods. This line is typically used to confirm trends if the price goes above it, it is expected to continue upwards.
The Tenkan Sen is called the turning line. It is found like the Kijun Sen, averaging the highest highs and lowest lows, but over nine trading periods. This line is considered a second way to confirm trends. If it is slanted upwards, the market is trending up, and vice-versa if it is slanted downwards.
What Is The Chikou Span
The Chikou Span is referred to as the lagging line. It takes the current trading sessions closing price and plots it 26 trading periods behind. The Chikou Span can be used as a trend indicator. For instance, if this line crosses the price in a bottom-up direction, then the price is likely to go up in 26 periods.
Read More
The final part is the Senkou Span, it is comprised of 2 separate lines. The first is found by averaging the Tenkan Sen and the Kijun Sen and plotting it 26 periods ahead. The second line is found by averaging the highest highs and lowest lows over the past 52 trading periods. Then, like the first line, you plot it 26 periods ahead. This part of the Ichimoku Cloud provides dynamic support and resistance lines to help traders place more effective trades.
#4: Relative Strength Index (RSI)
Regarding penny stocks and relative strength, this momentum indicator is like the ADX and Stochastic in the sense that it is located below the stock chart. Furthermore, it also has a value range of 0 to 100. It identifies whether or not a stock is overbought or oversold in the market.
Typically, a stock with an RSI below 30 is considered oversold. If the RSI is over 70, the market is overbought. More advanced traders will change those values to 20 and 80 to reduce the likelihood of fakeouts.
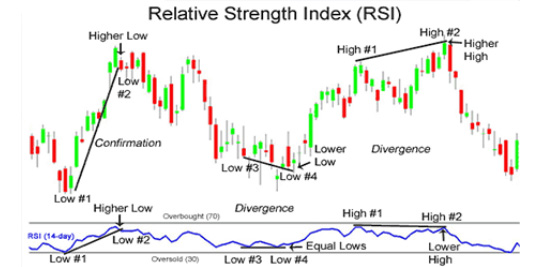
This indicator can help investors locate where new trends start by showing where the tops and bottoms are. In addition, the RSI can be used to confirm trends. If the RSI is above 50, the market is most likely in an uptrend.
The RSI can mean two different things to 2 different types of trades. On the one hand, you can pick out stocks earlier for more significant profits, but it is riskier as the trend isn’t confirmed. On the other hand, it still allows investors to wait for confirmation, but that eats away at the profit margins. The main difference between these two types of traders is their risk tolerance.
Penny Stocks & Volatility Indicators
#1: Bollinger Bands
Bollinger bands utilize a simple moving average, then two additional lines are plotted two standard deviations away from the moving average. Those two lines are what make up the band. You can assess the state of the market based on how narrow or wide the band is. If narrow, the market is considered quiet, and if it is wide, it is loud.
– Trading Options 101: A Beginner’s Guide
This indicator is versatile and can be used in trending and ranging markets. Ranging markets occur when a stock is trading sideways. If a stock is trading sideways, a Bollinger Bounce can occur. This is when the stock price is going up and down, bouncing off the band lines.
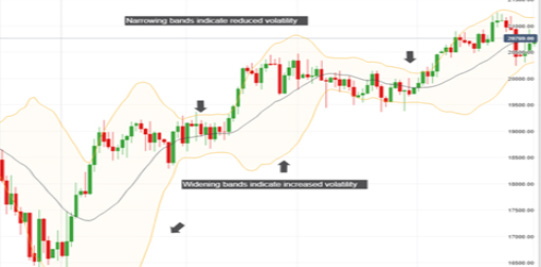
In a way, those band lines act as support and resistance lines for the stock’s price. The Bollinger Bands allow investors a more versatile way of assessing when to buy low and sell high.
The other way you can utilize Bollinger Bands is in a trending market. This is done through the use of the Bollinger Squeeze. This occurs when the bands begin to close in on each other, signaling the potential for a breakout. The main problem is that the breakout can either be upwards or downwards. This is a problem because the Bollinger Bands do not indicate which was the breakout will happen.
Utilizing Multiple Indicators At Once With Penny Stocks
No trader relies on a single indicator. This is due to the potential for fake outs where investors think something might happen, but the opposite occurs. They will end up losing money due to this. To mitigate this problem, investors combine several indicators to confirm whether or not they like what they see.
This will make your trades much sharper and hopefully bring you more profits than losses. Here are a few examples that you can utilize:
#1: Bollinger Bands & Relative Strength Index
Let’s say you have a stock trending downwards within the Bollinger Bands. As the stock continues to climb, you notice that the bands are starting to come together. This means that a Bollinger Squeeze is about to happen. Remember, we cannot detect whether or not it will go upwards or downwards. Here is where the RSI comes in to hopefully save the day.
During the same time frame, the RSI shows that a stock is oversold while the bands are squeezing. This means that based on the RSI, the stock is expected to bounce back and move upwards. This would be a solid buy signal for a lot of investors.
#2: Relative Strength Index, Average Directional Index, & Volume
Picture this, a stock has been trading sideways and shows a sign of a potential upwards breakout. This potential is supported by the RSI, which shows the stock is oversold. However, as a trader, you know that the stock could continue downward, so you go to check the volume levels. You notice that volume has not increased, meaning there might not be an upwards move.
A week went by, and the stock did end up making a move up. You are considering getting in because the stock is making a move you do not want to miss. This is where the ADX comes in to save your money. You notice that the ADX is below 20 telling you that the trend is very weak. As a result, you hold off on placing the trade to see what happens. Lo and behold, the stock’s move stops and starts moving downwards. Crisis averted.
Penny Stocks To Buy For Beginners
Data can give some insight into the market potential of certain companies. But there’s no substitute for education. Learning how to trade is more valuable than simply finding the next stock pick from a random social media account.
True Trading Group, the fastest-growing & highest-rated online premium educational platform available today, offers a 7-day Trial of its platform for $3 (non-autorenewing, nonrecurring): To Learn More Click Here.
It’s also worth reading some articles on introduction to trading below:
- How To Buy Penny Stocks & 5 Ways To Make Money Doing It
- Investing in Penny Stocks: What You Need to Know Before You Begin
- Are Penny Stocks Worth It?
- Penny Stocks To Buy: 5 Tips For Trading Stocks Under $5
- Penny Stocks, How To Buy Them & Day Trading Basics For 2023
- Trading Options 101: A Beginner’s Guide
Want the Top Penny Stocks Picks, Alerts, News & More? It’s Free & As Easy As 1, 2, 3!
- Take out your cell phone
- Open your text messaging
- Send a new text message with the word PENNYSTOCKS to 77567