CPI Report Live: Consumer Price Inflation Report Is Out, Here’s What It Shows

Originally Posted: 3/14/2023 8:30 AM ET
Updated: 3/14/2023 8:45 AM ET
If you’re trading penny stocks or large-cap stocks, we can all agree research is something that will help you better navigate trends. This week is all about inflation data and the January CPI inflation data is coming in the stock market today. In this update, we break down the most important things to know about February’s Consumer Price Index report. We also discuss some of the basics of CPI, what it is, and why it’s important. That will come in particularly handy if you’re new to stock market economic data in 2023.
CPI Inflation Data & The CPI Report Defined
October CPI inflation data sparked some brief, bullish optimism heading into the end of the year. While volatility returned thanks to PPI results, the final CPI report of 2022 is the crown jewel for anyone hoping for a Santa Claus rally. If you’re new to economics or the stock market, you might not understand what CPI inflation data is or what to look for in the November CPI report.
What Is CPI Inflation Data? CPI stands for “Consumer Price Index.”
The U.S. Bureau of Labor Statistics explains it as“The CPIs are based on prices of food, clothing, shelter, fuels, transportation, doctors’ and dentists’ services, drugs, and other goods and services that people buy for day-to-day living. Prices are collected each month in 75 urban areas across the country from about 6,000 housing units and approximately 22,000 retail establishments (department stores, supermarkets, hospitals, filling stations, and other types of stores and service establishments).”
– Penny Stocks Trading: Tips for Setting Realistic Investing Goals
CPI data measures “the average change over time in the prices paid by urban consumers for a market basket of consumer goods and services. Indexes are available for the U.S. and various geographic areas.”
Last CPI Report Recap: Consumer Price Index Report For January 2023 & CPI Numbers
The Consumer Price Index for All Urban Consumers (CPI-U) rose 0.5% in January on a seasonally adjusted basis, after increasing 0.1% in December, the U.S. Bureau of Labor Statistics reported today. Over the last 12 months, the all items index increased 6.4% before seasonal adjustment.
Shelter
The index for shelter was by far the largest contributor to the monthly all items increase, accounting for nearly half of the monthly all items increase, with the indexes for food, gasoline, and natural
gas also contributing. The food index increased 0.5% over the month with the food at home index rising 0.4%. The energy index increased 2.0% over the month as all major energy component indexes rose over the month.
All Items Less Food & Energy
The index for all items less food and energy rose 0.4% in January. Categories which increased in January include the shelter, motor vehicle insurance, recreation, apparel, and household furnishings and operations indexes. The indexes for used cars and trucks, medical care, and airline fares were among those that decreased over the month.
All Items
The all items index increased 6.4% for the 12 months ending January; this was the smallest 12 month increase since the period ending October 2021. The all items less food and energy index rose 5.6% over the last 12 months, its smallest 12-month increase since December 2021. The energy index increased 8.7% for the 12 months ending January, and the food index increased 10.1% over the last year.
Consumer Price Index Report For February 2023 & CPI Numbers
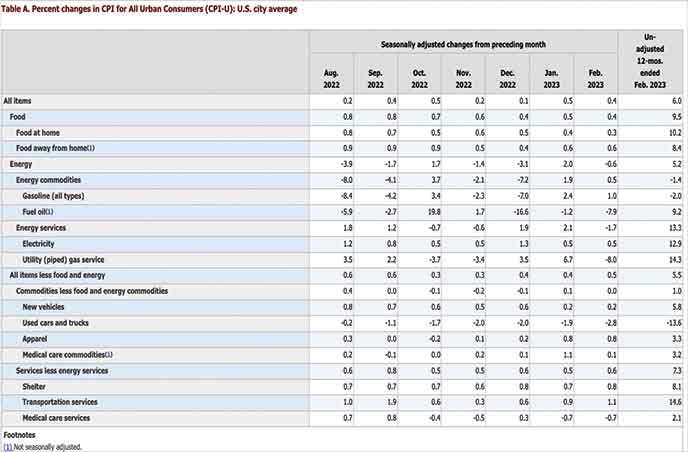
The Consumer Price Index for All Urban Consumers (CPI-U) rose 0.4% in February on a seasonally adjusted basis, after increasing 0.5% in January, the U.S. Bureau of Labor Statistics reported today. Over the last 12 months, the all items index increased 6.0% before seasonal adjustment.
The index for shelter was the largest contributor to the monthly all items increase, accounting for over 70% of the increase, with the indexes for food, recreation, and household furnishings and
operations also contributing. The food index increased 0.4% over the month with the food at home index rising 0.3%. The energy index decreased 0.6% over the month as the natural gas and fuel oil indexes both declined.
The index for all items less food and energy rose 0.5% in February, after rising 0.4% in
January. Categories which increased in February include shelter, recreation, household furnishings and operations, and airline fares. The index for used cars and trucks and the index for medical care were among those that decreased over the month.
The all items index increased 6.0% for the 12 months ending February; this was the smallest
12-month increase since the period ending September 2021. The all items less food and energy index rose 5.5% over the last 12 months, its smallest 12-month increase since December 2021. The energy index increased 5.2% for the 12 months ending February, and the food index increased 9.5% over the last year.
Breaking Down The CPI Data: Key Takeaways
- CORE CPI: 0.5% MoM (HIGHER THAN EXPECTED), 5.5% YoY (IN LINE)
- CPI: 0.4% MoM (IN LINE), 6% YoY (IN LINE)
- The food index increased 0.4% in February, and the food at home index rose 0.3% over the month. Five of the six major grocery store food group indexes increased over the month. The index for nonalcoholic beverages increased 1.0% in February, after a 0.4% increase the previous month.
- The food away from home index rose 0.6% in February, as it did in January. The index for limited service meals increased 0.7% over the month and the index for full service meals increased 0.6%.
- The energy index fell 0.6% in February, after increasing 2.0% in January. The natural gas index decreased 8.0% over the month, the largest 1-month decrease in that series since October 2006.
- The fuel oil index fell 7.9% over the month, following a 1.2% decline in January. In contrast, the gasoline index rose 1.0% in February, following a 2.4% increase in the previous month.
- The energy index rose 5.2% over the past 12 months. The fuel oil index rose 9.2% over the last 12 months, while the index for electricity rose 12.9%, and the index for natural gas increased 14.3% over the same period. The gasoline index decreased 2.0% over the span.
- The index for all items less food and energy rose 0.5% in February, after rising 0.4% in January. The shelter index continued to increase, rising 0.8% over the month.
- The index for rent rose 0.8% in February, while the index for owners’ equivalent rent increased 0.7% over the month. The index for lodging away from home increased 2.3% in February.
- The medical care index fell 0.5% in February, after falling 0.4% in January. The index for physicians’ services continued to decline, falling 0.5% after declining 0.1% in January. The hospital services index and the prescription drugs index were unchanged in February.
- The index for all items less food and energy rose 5.5% over the past 12 months. The shelter index increased 8.1% over the last year, accounting for over 60% of the total increase in all items less food and energy.
- Other indexes with notable increases over the last year include motor vehicle insurance (+14.5%), household furnishings and operations (+6.1%), recreation (+5.0%), and new vehicles (+5.8%).
When is the next CPI inflation data report? The Consumer Price Index for March 2023 is scheduled to be released on Wednesday, April 12, 2023, at 8:30 a.m. (ET).
The Stock Market Today After February CPI Inflation Report
The February CPI report brought a mixed bag of trading action in the stock market today. Generally speaking, bulls and bears were in a tight tug-of-war immediately following the results with a lean to the upside. The S&P 500 (NYSE: SPY) tested highs of $390 while the tech heavy, growth-focused Nasdaq (NASDAQ: QQQ) jumped to nearly $295.
There’ve been plenty of concerns over what the Federal Reserve’s next move will be on the state of rate hikes. Will there be a 50bps hike, 25 bps or will the Fed pause rate hikes in March? That answer will be revealed next week at the next FOMC meeting on March 21, 2023, and March 22, 2023. The meeting is also associated with a Summary of Economic Projections.
Other than broader markets, traders remain focused on the regional banks. Thanks to the implosion of Silicon Valley Bank last week and at the start of this week, some speculate on the “next financial crisis” beginning in 2023. While the prospects of that actually happening are very speculative right now, the massive sell-off has been seen as an opportunity to some.
For example, shares of First Republic Bank (NYSE: FRC) have firmly bounced from lows of $17.53 on Monday to over $50 today. Western Alliance stock (NYSE: WAL) was trading at highs of $36 during the premarket compared to lows of $7.46 on Monday morning. Meanwhile, the “big banks,” including JP Morgan (NYSE: JPM), had reclaimed a significant portion of recent losses by Tuesday’s premarket session.