The Most Important Penny Stocks Trading Indicators

3 Penny Stocks Trading Indicators
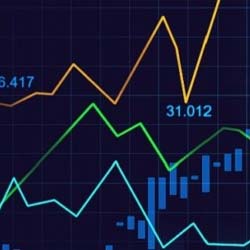
Penny stocks can be an exciting but risky investment. With prices that can move quickly and significantly, it’s important to have a solid trading plan in place to manage risk and maximize profits. One key aspect of any trading plan is the use of technical analysis to identify trends, patterns, and signals in price movements. In this article, we’ll look at three of the most important indicators for trading penny stocks.
The first indicator is the Relative Strength Index (RSI), which measures the strength of a stock’s price movement. The RSI is calculated using a formula that takes into account the stock’s gains and losses over a specific period of time, typically 14 days. A high RSI value indicates that the stock is overbought and may be due for a price correction, while a low RSI value suggests that the stock is oversold and may be due for a price increase.
[Read More] Penny Stocks Trading: How News Plays a Role
The second indicator is Moving Averages, which are used to smooth out price movements over a specified time period. Traders often use two moving averages – a shorter one and a longer one – to identify trend changes. When the shorter moving average crosses above the longer moving average, it’s considered a buy signal, while a cross below is a sell signal.
The third indicator is Bollinger Bands, which are used to measure a stock’s volatility. Bollinger Bands consist of a moving average and two bands that are placed above and below the moving average. The bands are calculated based on the stock’s standard deviation, and they expand or contract depending on the level of volatility. When the price moves outside of the bands, it’s considered a potential reversal signal.
In summary, the Relative Strength Index, Moving Averages, and Bollinger Bands are all important indicators for trading penny stocks. By incorporating these tools into your trading plan, you can better identify potential opportunities and manage your risk. However, it’s important to remember that no indicator is foolproof, and it’s always wise to use multiple indicators and to perform thorough research before making any investment decisions.
3 Indicators That Penny Stocks Traders Should Use
- Relative Strength Index (RSI)
- Moving Averages
- Bollinger Bands
Relative Strength Index (RSI)
The Relative Strength Index (RSI) is a momentum oscillator that measures the strength of a stock’s price movement. It is one of the most widely used indicators for trading penny stocks. The RSI is calculated by comparing the average gains and losses over a specific period of time, typically 14 days. The RSI ranges from 0 to 100, with a reading above 70 indicating that the stock is overbought and may be due for a price correction, while a reading below 30 suggests that the stock is oversold and may be due for a price increase.

For penny stock traders, the RSI can be a valuable tool to help identify potential buy and sell signals. When a stock’s RSI is above 70, it is considered overbought and traders may consider selling their positions. Conversely, when a stock’s RSI is below 30, it is considered oversold and traders may consider buying the stock.
[Read More] How to Set Expectations For Penny Stocks Trading
However, it is important to note that the RSI should not be used in isolation. It should be used in conjunction with other forms of analysis and research, and should never be relied upon solely to make investment decisions. Additionally, traders should be aware of false signals that may occur when a stock’s price movement is volatile.
Moving Averages
Moving Averages are another important tool for penny stock traders. They are used to smooth out price movements over a specified time period and can help identify trends in a stock’s price movement. Traders often use two moving averages – a shorter one and a longer one – to identify trend changes. When the shorter moving average crosses above the longer moving average, it is considered a buy signal, while a cross below is a sell signal.
For penny stock traders, moving averages can be particularly useful when trading volatile stocks. By using moving averages to identify trend changes, traders can potentially avoid false signals and reduce their risk. However, it is important to note that moving averages are not foolproof and should be used in conjunction with other forms of analysis and research.
Bollinger Bands
Bollinger Bands are a popular technical indicator that are used to measure a stock’s volatility. They consist of a moving average and two bands that are placed above and below the moving average. The bands are calculated based on the stock’s standard deviation, and they expand or contract depending on the level of volatility. When the price moves outside of the bands, it is considered a potential reversal signal.
For penny stock traders, Bollinger Bands can be a valuable tool for identifying potential buy and sell signals. When a stock’s price moves outside of the bands, traders may consider buying or selling the stock, depending on the direction of the price movement. However, it is important to note that Bollinger Bands should not be used in isolation and should be used in conjunction with other forms of analysis and research.
In conclusion, the Relative Strength Index, Moving Averages, and Bollinger Bands are all important indicators for trading penny stocks. While these tools can be helpful in identifying potential buy and sell signals, it is important to remember that they should be used in conjunction with other forms of analysis and research. With a disciplined approach and a sound trading plan, investors can potentially achieve significant returns in the world of penny stocks.
3 Penny Stocks to Watch Right Now
- Obseva SA (NASDAQ: OBSV)
- Genius Group Ltd. (NYSE: GNS)
- Faraday Future Intelligent Electric Inc. (NASDAQ: FFIE)
Are Penny Stocks Worth It or Not?
In conclusion, trading penny stocks can be a challenging and rewarding experience. While there are many factors to consider when making investment decisions, technical analysis can provide valuable insights into price movements and trends. The Relative Strength Index, Moving Averages, and Bollinger Bands are three of the most important indicators for buying and selling penny stocks.
[Read More] Penny Stocks Trading: How News Plays a Role
By using these tools to help identify potential buy and sell signals, investors can better manage their risk and increase their chances of success. However, it’s important to remember that technical analysis should be used in conjunction with other forms of analysis and research, and should never be relied upon solely to make investment decisions. With a disciplined approach and a sound trading plan, investors can navigate the world of penny stocks and potentially achieve significant returns.