Penny Stocks Chart School: Bear Flag Defined
Penny Stocks & Chart Patterns
Bear Flag Definition & Example
A bear flag chart pattern is a technical analysis pattern that can help traders identify potential opportunities to sell a security. This pattern is typically seen as a corrective pattern that follows a downtrend. It is characterized by a sharp price decline. Then it’s followed by a period of consolidation where a security’s price moves sideways within a defined trading range.
What does a bear flag look like?
Whether you’re trading penny stocks or Tesla (NASDAQ: TSLA), identifying and using a bear flag chart pattern is the same.
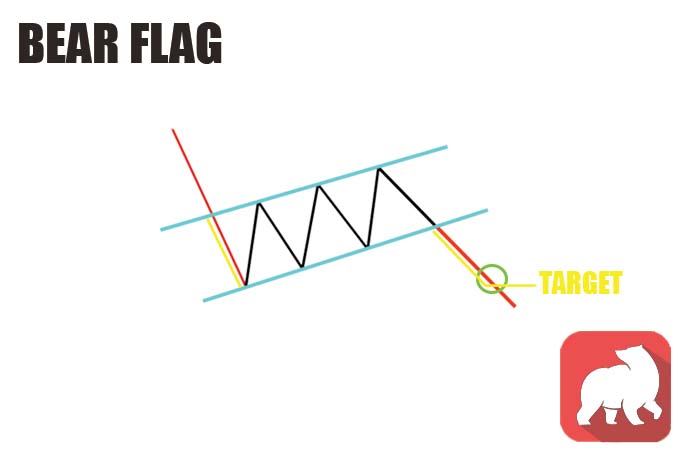
To identify a bear flag pattern, traders should look for a downtrend in the security’s price. This can be identified using trendline analysis, moving averages, or other technical indicators. Once the downtrend has been identified, traders should look for a sharp price decline. The decline is followed by a period of consolidation. The security’s price moves sideways within a defined range known as the “flag.” It is typically characterized by relatively low trading volume and small price movements.
The bear flag pattern gets its name because it is generally seen as a corrective pattern following a downtrend. This means it can be a potential sign that the downtrend will resume. Traders can use this to make informed trading decisions on shorting or limiting risk.

To trade penny stocks or higher-priced stocks using a bear flag pattern, traders will typically wait for the pattern to form. Then they’ll look for a breakdown below the flag’s consolidation range. This can be seen as a sign that the downtrend is set to resume. Now, traders can look to enter short positions in the security in anticipation of further price declines. Alternatively, some traders may wait for a breakout confirmation before entering a trade.
Bear Flag Volume Profile
In a bear flag pattern, the volume profile is typically characterized by a sharp increase in trading volume during the initial price decline. Then a period of relatively low trading volume during the consolidation phase.
Initial Price Decline
During the initial price decline, the increased trading volume can be seen as a sign of intense selling pressure as traders look to exit their positions in the security. This increased volume can also help to confirm the downtrend and add validity to the bear flag pattern.
Consolidation Period
During the consolidation phase, the volume profile typically shows a decrease in trading volume as the security’s price moves sideways. This low volume can be seen as a sign of indecision among traders, which can help confirm the flag pattern. By analyzing the volume profile alongside the price action, traders can better understand the underlying forces at work in the market.
One way to set profit targets using a bull flag stock chart pattern is to use the initial downtrend line of the flag (the flag pole) as a reference point. This can be done by measuring the distance between the flagpole and the flag (consolidation period). Then project the same distance from the bottom of the flag (or top if you really think about it. See example). This is a more aggressive way to determine profit targets and doesn’t always work out.
Conservative traders will use the distance between the flag’s parallel lines. They’ll then use that to forecast a profit target (outlined below). The bottom line is that nothing is perfect or set in stone. So use your trading strategy and game plan whenever entering or exiting a trade. Chart patterns are accurate until they aren’t. Make sure you understand how to trade stocks, no matter what the fundamental “rules” of a chart pattern are.
Bearflag Chart Patterns & Day Trading Penny Stocks
It is important to remember that bear flag patterns are just one of many technical analysis tools and should not be relied on exclusively. They can be valuable tools for identifying potential short-selling opportunities. It is always a good idea to use various technical and fundamental analysis techniques to make informed trading decisions.
A bear flag chart pattern is a technical analysis pattern that can help traders identify potential opportunities to sell a security or avoid the further downside. This pattern is characterized by a sharp price decline followed by a period of consolidation, and it can be a valuable tool for identifying potential short-selling opportunities.
However, it is important to remember that bear flag patterns should not be relied on exclusively, and traders should always use a variety of analysis techniques to make informed trading decisions.
More About Penny Stocks
This is part of our series about Penny Stock Chart Patterns. We’ll discuss more bullish and bearish patterns so that you can be prepared for all market conditions. You’ll also want to understand other nuances of trading penny stocks or higher-priced stocks in general. If you’re getting your feet wet, check out some of these articles below:
- Buy Penny Stocks Like Hedge Funds Do: A How-To Guide
- Making Profits With Penny Stocks, Beginners Guide
- 10 Secret Ways To Find The Best Penny Stocks To Buy In 2022 [Updated]
- Trading Options 101: A Beginner’s Guide
- Penny Stocks: 7 Day Trading Strategies for Beginners
- Are Penny Stocks Good For Beginners? [Answered]
- What Are Penny Stocks? A Beginner’s Guide To Making Money Trading
New To Trading Penny Stocks?
If you’re interested in learning more about penny stocks, the stock market, and how to trade, check out True Trading Group, the fastest-growing & highest-rated online premium educational platform available today. True Trading Group offers a 7-day Trial of its platform for $3 (non-autorenewing, nonrecurring): To Learn More Click Here.
Want the Top Penny Stocks Picks, Alerts, News & More? It’s Free & As Easy As 1, 2, 3!
- Take out your cell phone
- Open your text messaging
- Send a new text message with the word PENNYSTOCKS to 77567