Buying Penny Stocks? 3 Technical Indicators to Use

3 Technical Indicators to Use for Trading Penny Stocks
When it comes to penny stocks, there are a lot of things that go into making a successful investment. You have to have a firm understanding of the stock market, know what stocks are worth investing in, and have a solid plan for how you’re going to make your money back. But one thing that is often overlooked is the importance of technical indicators.
[Read More] 5 Penny Stocks To Buy According To Analysts Right Now
Technical indicators are a valuable tool that can help you find penny stocks that are ready to make a move. By looking at things like volume, price, and momentum, you can get a better idea of which stocks are about to take off. And when you’re able to identify these stocks early, you’ll be in a much better position to make a profit. So if you’re looking for penny stocks to buy, don’t forget to consider the technical indicators. They could be the key to finding the next big winner. Some major technical indicators include:
- Relative strength index (RSI)
- Moving average convergence divergence (MACD)
- Bollinger bands
Each technical indicator can be used in different ways, but they all ultimately aim to do one thing: give you an edge in the market. When you know how to use them correctly, they can be a powerful tool for finding penny stocks that are ready to take off. So if you’re serious about making money in the stock market, make sure you learn how to use technical indicators. They could be the key to your success. With this in mind, let’s take a look at what happened in the stock market on October 25th.
What Happened in the Stock Market on October 25th
On Tuesday, both penny stocks and blue chips fell following some less-than-stellar results from some big tech companies. Specifically, the Dow Jones, S&P 500, and NASDAQ fell by 75 points, 0.24%, and 0.96% respectively. While this is not a major deal on its own, it does contribute to the overall volatility that we’ve seen as of late. So, with this in mind, let’s take a look at three technical indicators to use for trading penny stocks right now.
3 Technical Indicators For Your Trading Strategy
- Relative Strength Index
- Moving Average Convergence Divergence
- Bollinger Bands
Relative Strength Index
In order to trade penny stocks successfully, you need to understand what the relative strength index (RSI) is and how it works. The RSI is a technical indicator that measures the speed and change of price movements. It is used to determine whether a stock is overbought or oversold. stocks that have an RSI above 70 are considered to be overbought, and stocks with an RSI below 30 are considered to be oversold.
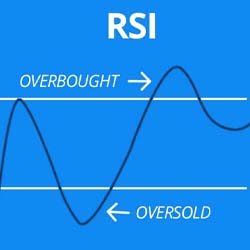
The RSI is a valuable tool for penny stock traders because it can help you identify when a stock is about to make a move. If a stock has been in an uptrend and the RSI starts to fall, that is a sign that the stock may be about to reverse course. If a stock has been in a downtrend and the RSI starts to rise, that is a sign that the stock may be about to rebound.
The RSI can also help you identify stocks that are ripe for a breakout. If a stock has been trading sideways for awhile and the RSI starts to move up, that is a sign that the stock may be ready to make a move. The bottom line is that the RSI is a valuable tool for penny stock traders. If you understand how it works, you can use it to your advantage.
Moving Average Convergence Divergence
MACD is a technical analysis tool that stands for Moving Average Convergence Divergence. MACD is used to gauge the strength of a stock’s momentum and trend. The MACD indicator is calculated by subtracting the 26-day exponential moving average (EMA) from the 12-day EMA. A signal line is then created by taking a nine-day EMA of the MACD line.
MACD signals can be used to generate buy and sell signals for stocks. MACD divergences are considered especially powerful signals. A bullish divergence occurs when the stock price makes a new low, but the MACD doesn’t confirm the move by also making a new low. A bearish divergence occurs when the stock price makes a new high, but the MACD doesn’t confirm the move by also making a new high.
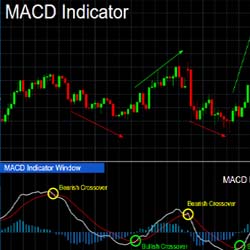
MACD crossovers are another type of signal that can be generated using the MACD indicator. A bullish crossover occurs when the MACD line crosses above the signal line. This indicates that momentum is shifting to the upside and that stocks may be due for a rally. Conversely, a bearish crossover occurs when the MACD line crosses below the signal line. This indicates that momentum is shifting to the downside and stocks may be due for a selloff.
[Read More] 3 Hot Penny Stocks To Buy Under $3 With Must Read News
While MACD signals can be helpful, it’s important to remember that they are not perfect. MACD signals should be used in conjunction with other technical indicators and chart patterns to confirm moves in the stock market.
Bollinger Bands
Bollinger Bands are a technical analysis tool that is used to measure market volatility. They were created by John Bollinger in the 1980s. Bollinger Bands consist of a upper and lower band that are placed two standard deviations away from a simple moving average. The bands expand and contract as the price of the security fluctuates.
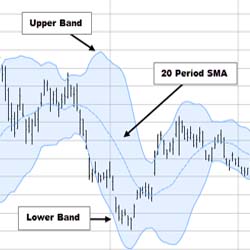
When the markets are volatile, the bands will widen and when the markets are stable, the bands will narrow. Bollinger Bands can be used to trade stocks, Forex, commodities, and cryptocurrency. There are many different strategies that traders use with Bollinger Bands. Some common strategies include using them as support and resistance levels, trading breakouts, and using them to identify market trends.
Bollinger Bands are a versatile tool that can be used by traders of all experience levels. If you are new to trading, Bollinger Bands can be a great place to start. They can also be used in conjunction with other technical indicators to create a robust penny stocks trading strategy.
4 Penny Stocks to Watch Right Now
- Taysha Gene Therapies Inc. (NASDAQ: TSHA)
- Revelation Biosciences Inc. (NASDAQ: REVB)
- Ideanomics Inc. (NASDAQ: IDEX)
- Faraday Future Intelligent Electric Inc. (NASDAQ: FFIE)
Which Penny Stocks Are You Watching Right Now?
Overall, using technical indicators is a helpful tool in finding penny stocks to buy. By understanding and utilizing different types of technical indicators, investors can make more informed decisions when it comes to penny stocks.
[Read More] Make Money With Penny Stocks in November? 3 Methods to Use
However, it is important to remember that no single indicator is perfect, and that multiple indicators should be used in order to get the most accurate picture possible. Technical analysis is just one part of the puzzle when it comes to investing; ultimately, it is up to the individual investor to make the final decision on which stocks to buy. With this in mind, which penny stocks are on your watchlist right now?