Inflation continues to drive stock prices lower this week. Wednesday’s CPI report showed that prices are still at record levels. The Consumer Price Index for All Urban Consumers (CPI-U) increased 0.3% in April on a seasonally adjusted basis after rising 1.2 % in March, the U.S. Bureau of Labor Statistics reported Wednesday. Over the last 12 months, the all items index increased 8.3% before seasonal adjustment. These figures came in hotter than expected, and the markets tumbled lower in response.
CPI Data Recap
- Increases in the indexes for shelter, food, airline fares, and new vehicles were the most significant contributors to the seasonally adjusted all items increase.
- The food index rose 0.9% over the month as the food at home index rose 1.0 percent. The energy index declined in April after rising in recent months.
- The index for gasoline fell 6.1% over the month, offsetting increases in the indexes for natural gas and electricity.
- The index for all items less food and energy rose 0.6% in April
- Along with indexes for shelter, airline fares, and new vehicles, the indexes for medical care, recreation, and household furnishings and operations all increased in April.
- The indexes for apparel, communication, and used cars and trucks all declined over the month.
What Is PPI?
This week we’ve also got producer prices and jobless claims to digest. The Producer Price Index or PPI measures “the average change over time in the selling prices received by domestic producers for their output. The prices included in the PPI are from the first commercial transaction for many products and some services.” This is according to the U.S. Bureau of Labor Statistics.
What to Know About Buying Penny Stocks on May 12th
March PPI Data
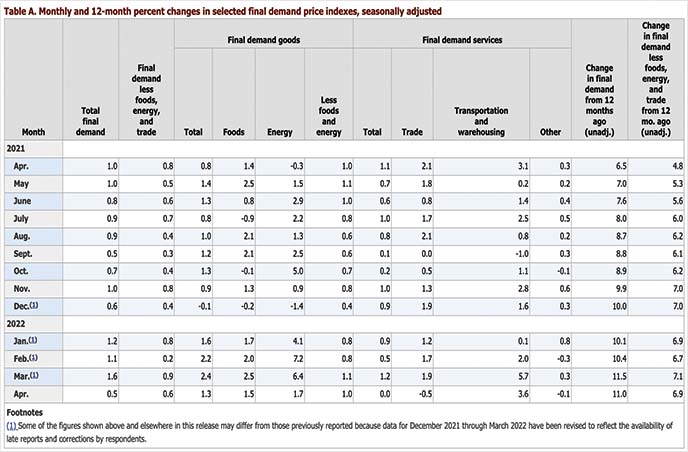
The Producer Price Index for final demand increased 1.4 percent in March. Prices for final demand goods advanced 2.3%, and the index for final demand services rose 0.9%. Final demand prices moved up 11.2% for the 12 months ended in March.
PPI Expectations for April
PPI is forecast to come in at 10.7% for April.
Jobless Claims Results For April 2022
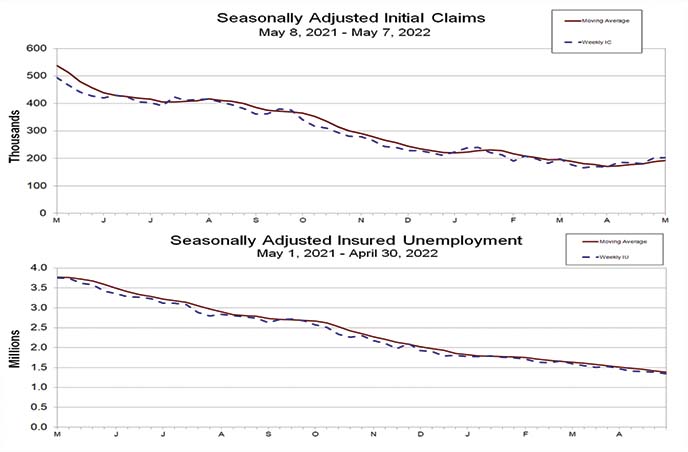
Jobless claims data is out, and here are the results:
- Initial claims: 203,000, which was above the 195,000 estimate
- Continuing Jobless Claims: 1.343 million vs. 1.38 million estimates. This compares to the prior read of 1.384 million.

PPI For April
According to the U.S. Bureau of Labor Statistics, the Producer Price Index for final demand increased 0.5% in April, seasonally adjusted. This jump came after increases of 1.6% in March and 1.1% in February. On an unadjusted basis, final demand prices moved up 11.0% for the 12 months ended in April.
The Bureau of Labor Statistics also said, “The index for final demand goods moved up 1.3 percent in April, the fourth consecutive rise. More than half of the broad-based increase in April can be traced to a 1.0-percent advance in prices for final demand goods less foods and energy. The indexes for final demand energy and for final demand foods also moved higher, 1.7 percent and 1.5 percent, respectively.”

The Stock Market Today
It looks like inflation is here to stay, and the Federal Reserve may need to take a more aggressive stance. Not much has changed as far as market sentiment is concerned. There weren’t any major glaring data points that suggested any difference in what we already knew on Wednesday. The S&P 500 ETF (NYSE: SPY) dipped to lows of $388.03, the Nasdaq ETF (NASDAQ: QQQ) to the mid-$280s, while the Dow ETF (NYSE: DIA) slipped to the $315 level for the first time since March of last year.
The Specifics of PPI Data
While there weren’t any significant shifts in sentiment, the Producer Price Index revealed a few fundamental changes. Prices for processed goods jumped 2.2%, with the index for unprocessed goods climbing 5.3%. In particular, The Bureau’s report cited:
The index for processed goods for intermediate demand climbed 2.2 percent in April, the fourth consecutive rise. In April, a 1.4-percent advance in prices for processed goods less foods and energy led the broad-based increase. The indexes for processed energy goods and for processed foods and feeds also moved higher, 4.5 percent and 2.9 percent, respectively. For the 12 months ended in April, prices for processed goods for intermediate demand jumped 21.9 percent.
Prices for things like truck transportation of freight also increased. The Data showed a jump of 4.4%. Automotive fuels and lubricants retailing, transportation, hospital outpatient care, and loan services also jumped.
3 Must Watch Penny Stocks For Your May 2022 List
Did any costs drop? Amid a sea of increases, some categories actually experienced declining prices. Margins for health, beauty, and optical goods retailing dropped 1.3%. Indexes for portfolio management, guestroom rental, hospital inpatient care, and furniture retailing also dropped.
PPI Data Take-Aways
What did we learn from this latest round of PPI data? There weren’t any significant divergences in sentiment that we couldn’t gather from the April CPI data. The biggest question now is what will the Federal Reserve do to help curb this rampant inflation? With consumer and producer prices rising and jobless claims rising, the filing for unemployment benefits continues pointing at a historically tight labor market. With the Producer Price Index for May 2022 scheduled for release on Tuesday, June 14, 2022, at 8:30 a.m. (ET), there’s still plenty of time to monitor any new data to come this month.


